(Real-world use case) Say you have 10,000 single-partition dask DataFrames, each… with known divisions. You want to combine them into one. Some don't overlap at all, but say 40% of them do overlap with a handful of the others. The obvious way to do this is `dd.concat(sorted(inputs, key=lambda df: df.divisions), interleave_partitions=True)`. You would expect that 60% of the resulting partitions would simply be a pass-through from the original input, and the others would just be a few tasks each combining those overlapping inputs.
However, `dd.concat` seems to add significant complexity to the graph when _any_ inputs overlap—_even to partitions that don't need to be combined with any others_. Here's a smaller reproducer.
```python
import pandas as pd
import dask.dataframe as dd
import dask
# Our three inputs don't overlap at all
a = pd.DataFrame({'n': 'a'}, index=range(1, 5))
b = pd.DataFrame({'n': 'b'}, index=range(10, 15))
c = pd.DataFrame({'n': 'c'}, index=range(20, 25))
a = dd.from_pandas(a, npartitions=1)
b = dd.from_pandas(b, npartitions=1)
c = dd.from_pandas(c, npartitions=1)
```
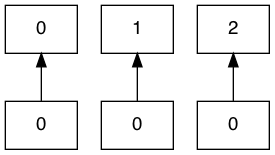
If you combine these, the graph is good: just a pass-through of the originals.
```python
x = dd.concat([a, b, c], interleave_partitions=True)
x.divisions
# (1, 10, 20, 24)
x.visualize(optimize_graph=True)
```
However, if even one of the inputs overlap, then all of them go sideways:
```python
# Last element in `b` is 14; make `c` overlap with it
c = pd.DataFrame({'n': 'c'}, index=range(14, 20))
c = dd.from_pandas(c, npartitions=1)
x = dd.concat([a, b, c], interleave_partitions=True)
x.visualize(optimize_graph=True)
```
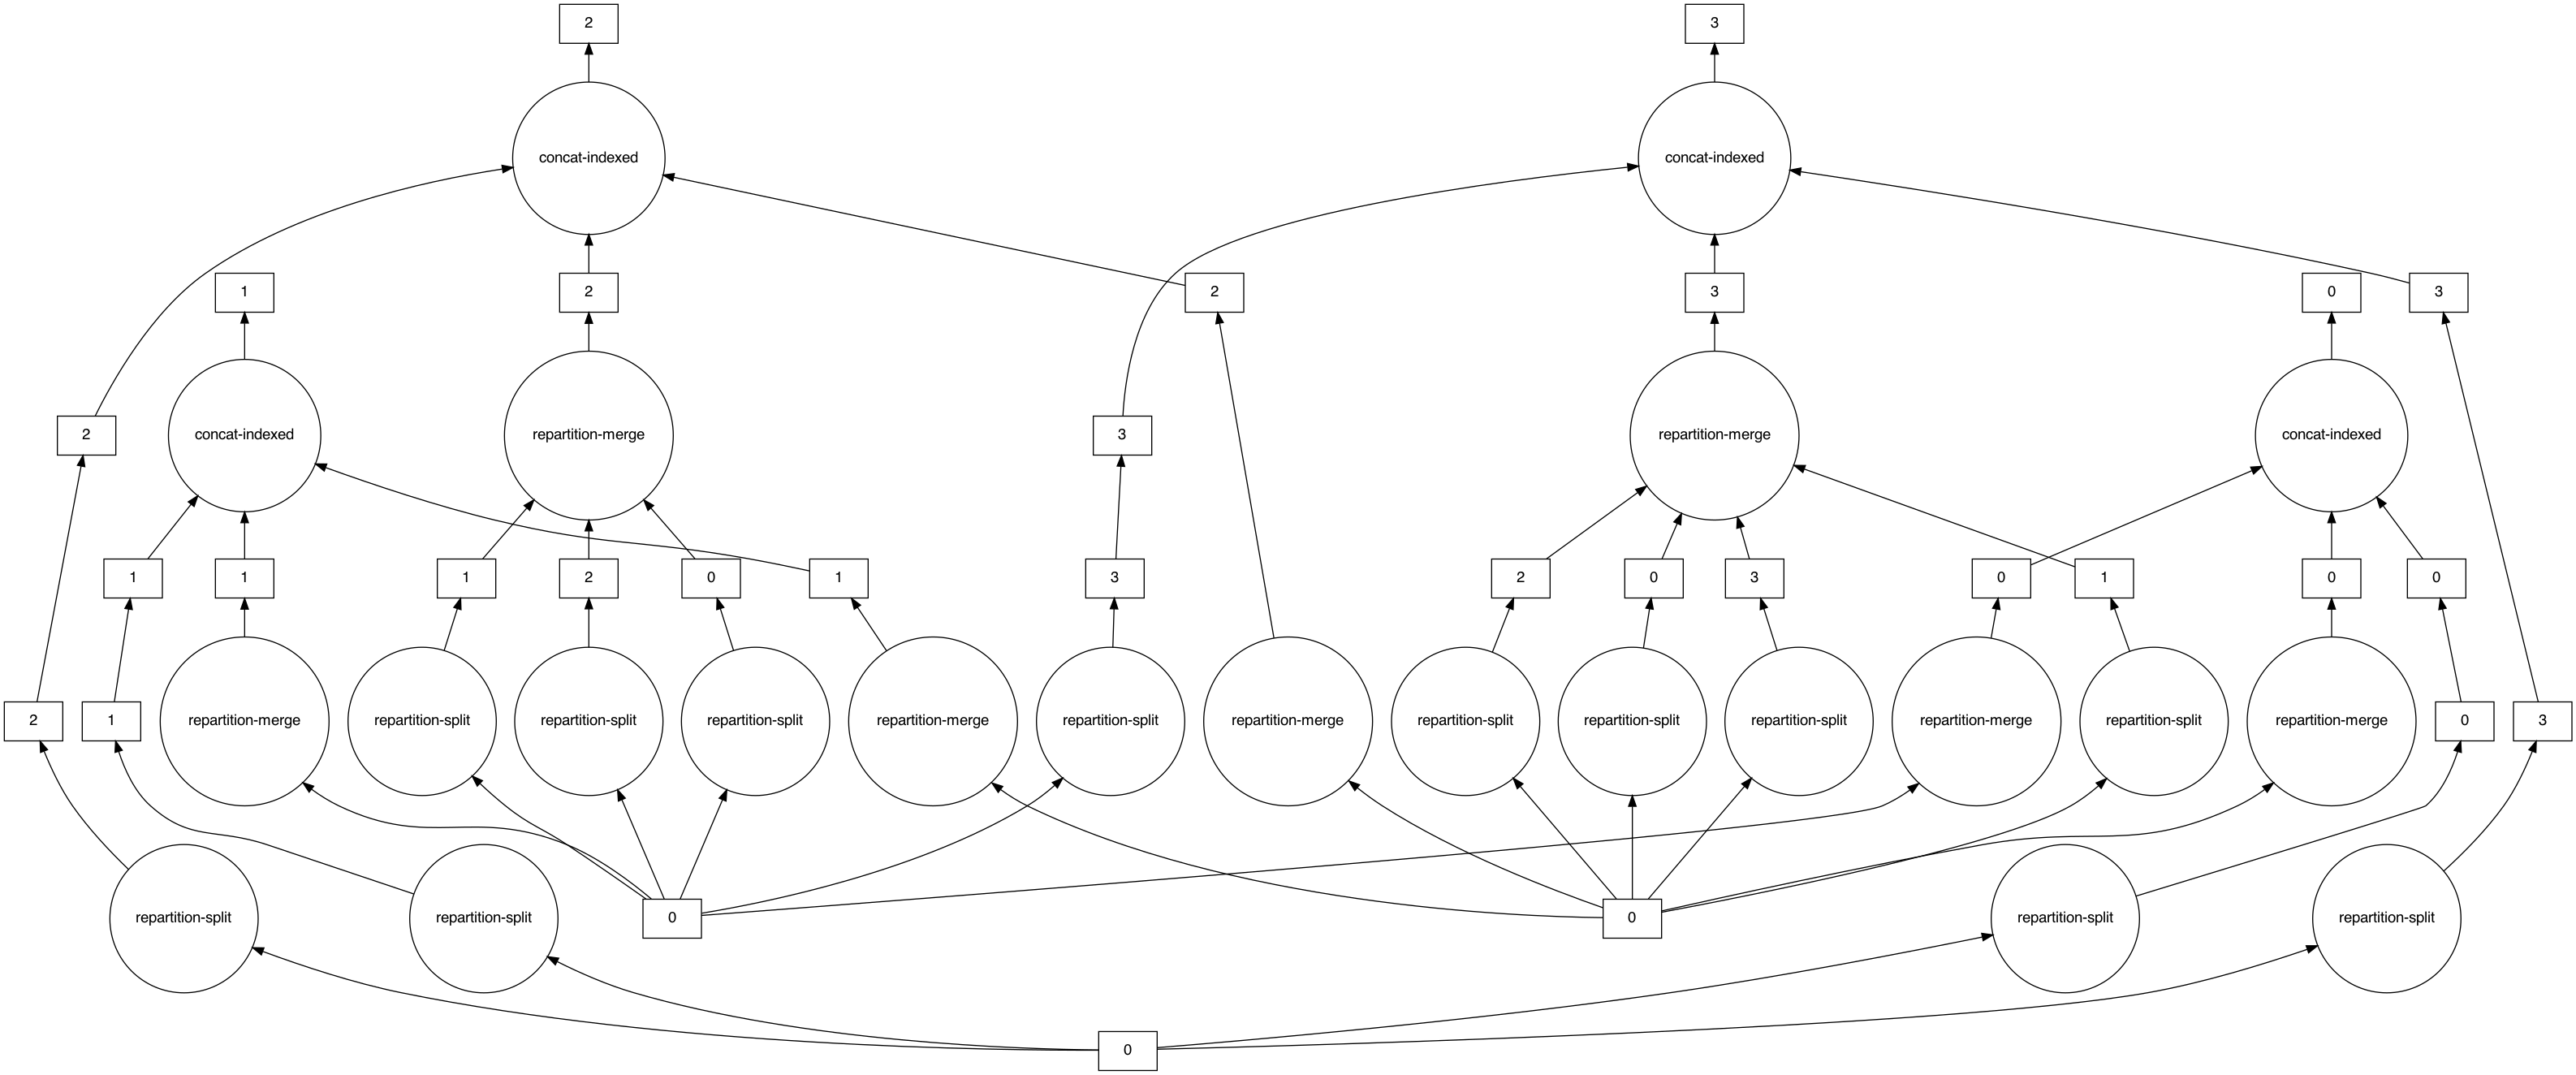
That graph seems unnecessarily convoluted! What's going on here?
```python
x.divisions
# (1, 4, 10, 14, 19)
```
First, an extra partition was added! Why is there now a split at `4` between 1 and 10? Our first input partition still overlaps with nothing, so it should still be a pass-through.
Here's what each output partition looks like:
```python
dask.compute([x.partitions[i] for i in range(x.npartitions)])
# ([ n
# 1 a
# 2 a
# 3 a,
# n
# 4 a,
# n
# 10 b
# 11 b
# 12 b
# 13 b,
# n
# 14 b
# 14 c
# 15 c
# 16 c
# 17 c
# 18 c
# 19 c],)
```
For some reason, 4 was split into its own single-row partition. There's probably an off-by-one error in the `concat_indexed_dataframes` logic somewhere; there's no good reason to do this. But this means partition 0 must no longer a pass-through operation.
But that's actually not the main problem. Let's look at the graph for just partition 0 (which again, overlaps with nothing, and should have been a pass-through operation):
```python
x.partitions[0].visualize(optimize_graph=True)
```
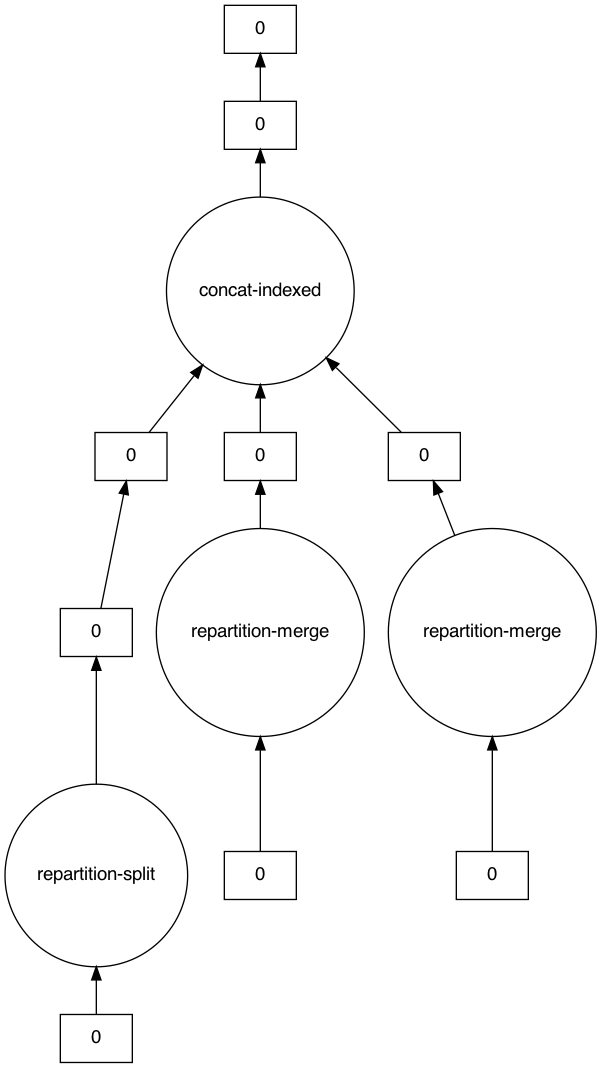
Notice how there are three separate `[ 0 ]` boxes as our root tasks. The fact that `visualize` displays them the same is misleading—these are actually our three input partitions.
**Our task that should have been a pass-through operation instead depends on every single other input dataframe!**
<details><summary>If we dig into the graph, we can see what's happening</summary>
```python
o, = dask.optimize(x.partitions[0])
dict(o.dask)
```
```python
{('blocks-fb54414703cd9f8c0b37fb039bc4f1b7',
0): ('concat-indexed-c623aeea3b4baf4272f1b15381c926b5', 0),
('concat-indexed-c623aeea3b4baf4272f1b15381c926b5',
0): (<function dask.dataframe.dispatch.concat(dfs, axis=0, join='outer', uniform=False, filter_warning=True, ignore_index=False, **kwargs)>,
[('repartition-merge-cb44e3c757ac1087e6bb6801dfc7afac', 0),
('repartition-merge-8596e038e334d6729b9486e4b0ecec92', 0),
('repartition-merge-1f6d669e193038e9e5ab917a2295c588', 0)],
0,
'outer',
False,
True,
{'ignore_order': False}),
('repartition-merge-cb44e3c757ac1087e6bb6801dfc7afac',
0): ('repartition-split-cb44e3c757ac1087e6bb6801dfc7afac', 0),
('repartition-merge-1f6d669e193038e9e5ab917a2295c588',
0): (<function dask.dataframe.methods.boundary_slice(df, start, stop, right_boundary=True, left_boundary=True, kind=None)>,
('from_pandas-cde2bda2bd6ad57faa7bd54164e47d74', 0),
14,
14,
False),
('from_pandas-cde2bda2bd6ad57faa7bd54164e47d74',
0): n
14 c
15 c
16 c
17 c
18 c
19 c,
('repartition-split-cb44e3c757ac1087e6bb6801dfc7afac',
0): (<function dask.dataframe.methods.boundary_slice(df, start, stop, right_boundary=True, left_boundary=True, kind=None)>, ('from_pandas-b6aa54b407dedd16e7128d4b817cbaef',
0), 1, 4, False),
('repartition-merge-8596e038e334d6729b9486e4b0ecec92',
0): (<function dask.dataframe.methods.boundary_slice(df, start, stop, right_boundary=True, left_boundary=True, kind=None)>, ('from_pandas-915f88967ee362178affd913ada85f7b',
0), 10, 10, False),
('from_pandas-915f88967ee362178affd913ada85f7b',
0): n
10 b
11 b
12 b
13 b
14 b,
('from_pandas-b6aa54b407dedd16e7128d4b817cbaef',
0): n
1 a
2 a
3 a
4 a}
```
First, notice that all three of our pandas DataFrames show up in the optimized graph for the first pass-through output partition. That's a dead giveaway that there's unnecessary communication going on.
You see the final `concat-indexed-c623aeea3b4baf4272f1b15381c926b5` depends on the three `repartition-merge`s. 2/3 of those are tasks that look like:
```
(<function dask.dataframe.methods.boundary_slice(df, start, stop, right_boundary=True, left_boundary=True, kind=None)>,
('from_pandas-cde2bda2bd6ad57faa7bd54164e47d74', 0),
14,
14,
False)
```
That's basically `boundary_slice(x, 14, 14)`—aka make an empty DataFrame, aka a no-op. So even though the dependency exists in the graph, its entire contents will be thrown away as soon as it arrives.
This should definitely be avoided.
</details>
------
So it seems like the [`concat_indexed_dataframes`](https://github.com/dask/dask/blob/63d608e6a21fa1b56b01e560c9b87b4019eaf12c/dask/dataframe/multi.py#L1001-L1033) logic could definitely be improved. I'm not sure whether the overall approach of `align_partitions` and then concat will make sense if we want to avoid these problems—is the problem in `align_partitions` itself, or in how `concat_indexed_dataframes` is using it?
If there's an underlying issue with `align_partitions`, that would be especially important to look into since it's used in a few paces (such as `merge_indexed_dataframes`). These sorts of "merge-by-known-divisions" operations are supposed to be the idiomatic, performant way to use dask, so the fact that this actually results in all-to-all communication is problematic.
cc @jsignell @jrbourbeau @jcrist